|
|


| |
| CORTICAL ATROPHY IN ALZHEIMER’S |
|
The clinical signs
of Alzheimer’s-type dementia can be explained by the areas of the brain
that are atrophied in succession by neurofibrillary
tangles and the build-up of amyloid plaques. These
two biological markers associated with Alzheimer’s seem to develop synergistically.
The neurotoxicity of the amyloid peptide has an impact on all parts of the brain,
but in
the mild stage of Alzheimer’s chiefly affects the areas around the hippocampus
where neurofibrillary tangles appear. These tangles,
which are caused by a pathology of the tau
protein, then intensify under the influence of the amyloid peptide dysfunctions. | 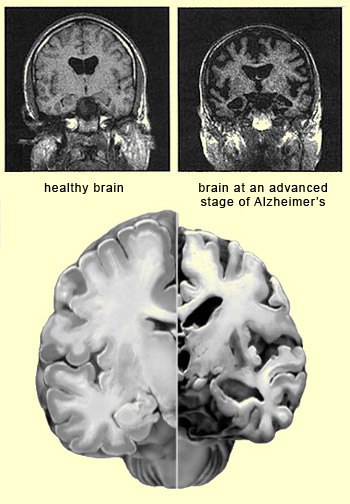 |
The neurofibrillary tangles then gradually extend
into other parts of the brain in a specific, invariable, hierarchical sequence
that is explained by the synaptic connections that these areas make with one another.
The tau pathology thus develops along anatomical pathways, and not by passive
diffusion. Neuroscientists have defined 10 stages
of tau pathology that correspond to 10 areas of the brain that atrophy in succession
(see the graph below). The clinical manifestations of this atrophy generally appear
around stage 5, 6, or 7, when the polymodal association cortices, such as the
parietal, anterior frontal, and superior temporal cortices, start to be affected. 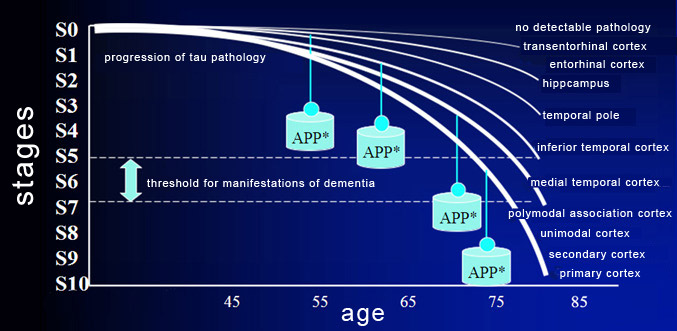
The
weight symbols marked
APP* represent the synergistic development of tau protein pathology and amyloid
plaques.
Source : www.lille.inserm.fr/u422
|
The threshold for clinical manifestations certainly
varies. It is modulated by many other conditions besides tau and amyloid protein
dysfunctions. These conditions include reduced trophic factors, the presence of
apoptotic factors (follow the Tool Module link to the left) and microinflammation,
astrocytic and microglial reactions, and oxidative stress. The
harmful effects of associated pathologies, such as vascular ones, can also raise
or lower this threshold. And, of course, there are other
environmental and genetic factors that influence neuronal vulnerability (and
hence the “neuronal reserve"), the healthy development of neural networks,
etc.
Brain imaging does not enable clinicians
to diagnose Alzheimer’s or to detect it before the first symptoms appear,
but nevertheless is a valuable tool for confirming the diagnosis and understanding
the progress of the brain atrophy associated with it. Promising
results have been obtained when classic imaging methods such as positron emission
tomography (PET) and magnetic resonance imaging (MRI) have been adapted to the
specific characteristics of Alzheimer’s. For
example, PET can be used to visualize the rate of absorption of glucose in various
parts of the brain, and thereby detect whether there are any areas that are absorbing
less. This information is very useful, because studies have shown that people
in the earliest
stages of Alzheimer’s absorb less glucose in certain parts of their
brains. PET is also used with the marker PiB (Pittsburgh
compound B), a fluorescent molecule that binds to beta-amyloid
peptide and can therefore be used to visualize the presence of the amyloid
plaques associated with Alzheimer’s disease. With
MRI, one can, for example, observe the atrophying of the hippocampus over time,
on the basis of measurements of its volume. Other applications of MRI to Alzheimer’s
research have also been developed, such as mapping the build-up of sodium in certain
areas of the brain—a phenomenon specific to Alzheimer’s. |
|
|