Tool Module: Brain Imaging
For
many years, scientists seeking to understand the structure and function of the
various parts of the human brain had only indirect methods of doing so. For example,
by performing post mortem dissections on the brains of healthy individuals
and of individuals who had displayed specific functional deficits caused by localized
brain lesions, scientists were able to make certain inferences about the functional
roles of particular brain structures. Another investigative method—selectively
destroying certain parts of the brain in animal subjects—confirmed the role
of certain brain structures that have been well preserved in the course of human
evolution. More recently, around the mid-20th century, researchers such as Wilder
Penfield developed the first functional maps of the human brain by applying electrical
stimuli to it directly, during surgical operations.
Since the early 1990s, however, a variety of imaging technologies have
revolutionized brain research. These technologies let scientists see what is happening
inside subjects’ brains without having to open up their skulls. Now researchers
can ask subjects to perform specific mental tasks, then “watch their brains
think”as they perform these tasks in real time. These imaging technologies
were made possible largely by the progress achieved in computer science and in
the detection of various forms of radiation toward the end of the 20th century.
Brain imaging is generally divided into two categories: structural imaging
and functional imaging.
The purpose of structural imaging is to visualize
the various structures of the brain and any physical abnormalities that may affect
them (such as tumours, bleeding, blood clots, or birth deformities).
The purpose of functional imaging is to measure activity in certain parts of the
brain while it performs certain tasks. Functional imaging is used chiefly in fundamental
research, to improve our understanding of the various structures of the human
brain. But functional imaging is also used to diagnose the foci of epileptic seizures,
as well as to identify, prior to brain surgery, parts of the brain that perform
essential functions and must be kept intact no matter what.
Very often,
a structural imaging technology may also be used together with a functional imaging
technology to better examine the anatomy and functioning of a particular area
of the brain in a particular individual.
The following
links will take you to brief descriptions of the structural and functional imaging
methods most commonly used today.
| Structural Imaging Methods | Functional Imaging Methods |
Computerized Tomography (CT) Magnetic Resonance Imaging (MRI) | |
| Stimulation Method | |
Transcranial Magnetic Stimulation (TMS) | Magnetoencephalography (MEG) |
Other Links on Brain Imaging
|
“Centres” of Cognitive Functions in the Brain: A Misleading Concept |
Computerized Tomography
(CT)
In computerized tomography (CT), a computer is
used to construct images of the brain (or other parts of the body) from a series
of x-ray scans. CT scanning has been available for about 25 years. Over this time,
it has undergone many technical enhancements that have made it one of the most
widely used methods in medical imaging today.
In CT scanning, the computer
reconstructs images from a series of X-ray scans taken from various angles. CT
scans thus provide far better resolution than conventional X-rays and can therefore
detect tumours and other lesions at far earlier stages.
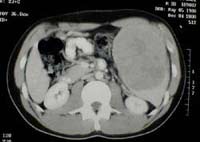
CT scan showing a spleen enlarged by a cancerous tumour
(to the right).
Source: Dr. Bob Richmond
In the reconstruction
process, the computer can also remove the radiographic “shadows” that
other parts of the body may cast on the organ of interest. This is possible because,
in the scanning process, the X-ray source revolves around the patient, thus photographing
the target organ from various angles. From each complete revolution,the computer
produces a cross-sectional image of this organ, known as a “slice”.
After several revolutions, the computer can sum these slices to produce a three-dimensional
image of the target organ.
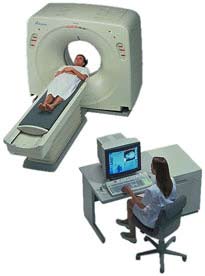
The
CT scanner is shaped like a donut, and the organ to be examined is placed at the
centre of the donut’s hole. Just as with a conventional X-ray machine, the
patient is exposed to a small dose of radiation during the scan. The X-ray emission
source revolves around the patient on one side, while the X-ray detector revolves
directly opposite, thus detecting the X-rays that have been differentially absorbed
as they passed through the various tissues of the body.
Depending on
the patient’s symptoms, he or she may be injected with or made to drink
a dye to increase the contrast between the normal and abnormal tissues. Some of
the most common uses for CT scans are to monitor patients’ progress after
surgery, radiation therapy, and chemotherapy, as well as to detect brain tumours,
blood clots, and other abnormalities.
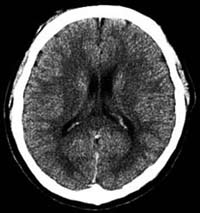
CT scan of a normal brain
Thanks
to the computer, the CT scanner provides doctors with a three-dimensional view
of both bone and soft tissue simultaneously. The doctors can then move forward
or backward through this view as they like to perform a detailed examination.
The latest generations of CT scanners move the radiation source around the
patient in a spiral pattern, instead of a series of separate circles, thus generating
the images more rapidly and with even better definition.
| Return to list of imaging methods |
Magnetic
Resonance Imaging (MRI)
When magnetic resonance imaging (MRI)
technology emerged in the late 1970s, it had the impact of a bombshell in the
medical community. The conventional imaging methods of the day relied on either
X-rays or ultrasound. But MRI uses magnetic fields instead, thereby exploiting
the physical properties of matter at the sub-atomic level, and especially of water,
which accounts for about 75% of the mass of the human body.
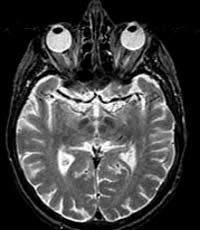
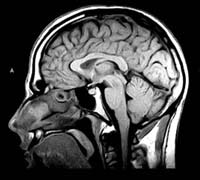
MRI scans
not only provide higher-definition images than CT scans, but they can also show
sagittal and coronal sections of the brain, not just the axial sections to which
CT scans are limited.
The
operation of an MRI scanner is fairly complex, but the main steps can be summarized
as follows.
- The scanner’s magnetic field aligns the far weaker magnetic fields of all the protons in all the hydrogen atoms in the water contained in the body’s tissues.
- The scanner then uses radio waves to bombard the part of the brain that is to be imaged.
- After the radio waves are turned off, the protons return to their original alignment. In the process, they emit a weak radio signal, known as their magnetic resonance. The intensity of this magnetic resonance is proportional to the density of the protons in the various tissues, and hence to the percentage of water that they contain.
- Special sensors detect the varying intensities of this resonance and relay this information to a computer.
- The computer processes this information to create images of tissue sections along various axes.
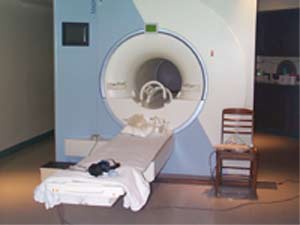
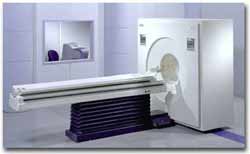
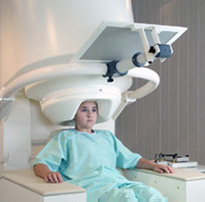
Before even entering the scanning room, much less being placed inside the scanner,
the patient must remove any metal objects that might be attracted by the magnetic
field. (People who wear prostheses or have arterial clips or pacemakers must avoid
having MRIs, for obvious reasons.) The scanner produces a fairly loud noise, so
the patient is also given earplugs to wear during the scan. The patient then lies
down on the table shown in the foreground in the above picture. In order to obtain
clear images, it is very important for the patient to lie as still as possible,
so his or her head is secured by restraints. The patient and the table are then
slid into the tunnel, which is scarcely more than shoulder-width. This tunnel
contains the wires that generate the magnetic field, as well as the coils that
receive the radio waves.
Though CT scans are still the primary tool
for imaging the chest and abdomen, MRI scans are the tools of choice for the brain,
hands, feet, and spinal column. Diseased or damaged tissues generally contain
more water, which allows them to be detected with MRI.
For MRI scans,
as for CT scans, the patient may be injected with a contrast agent. The agents
most commonly used for MRIs are compounds of the element gadolinium, which serves
the same purpose as iodine, but with less risk of allergic reactions.
| Return to list of imaging methods |
Electroencephalography
(EEG)
Many of the brain’s cognitive and motor functions
produce characteristic patterns of neuronal electrical activity. Electroencephalography
(EEG) is a method that amplifies these patterns and records them as distinctive
signatures on an electroencephalogram (also abbreviated EEG).
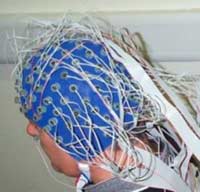
Electroencephalography
measures the brain’s overall neuronal activity over a continuous period
by means of electrodes glued to the scalp. Today’s computers can analyze
the brain activity sensed by several dozen electrodes positioned at various locations
on the scalp.
The
electrical currents picked up by these sensors are generated mainly by the dendrites
of the pyramidal neurons that are found in massive numbers in the cortex. These
neurons are oriented parallel to one another, which amplifies the signal from
their common activity.
The oscillations in an EEG can therefore be regarded
as the sum of the various oscillations produced by the various assemblies of neurons,
with all of these “harmonics” being superimposed on one another to
produce the total recorded trace. For purposes of analysis, this trace has the
same two characteristics as a sound wave: its oscillation frequency and its amplitude.
The frequencies of brain waves range from 0.25 Hz to 64 Hz (1 Hertz
equals 1 oscillation per second). A person’s state of consciousness (awake,
asleep, dreaming, etc.) has a decisive influence on the frequency of his or her
electroencephalogram.
Normal EEG
The frequency profiles
associated with certain brain activities have already been identified. Thus the
following types of brain waves may be found in an EEG:
delta: < 4
Hz (deep sleep, coma);
theta: 4-8 Hz (limbic activity: memory and emotions);
alpha: 8-12 Hz (person is alert but not actively processing information; predominant
in the occipital and frontal lobes, for example, when the eyes are closed);
beta: 13-30 Hz (person is alert and actively processing information);
gamma:
> 30-35 Hz (might be related to communications among various parts of the brain
to form coherent concepts).
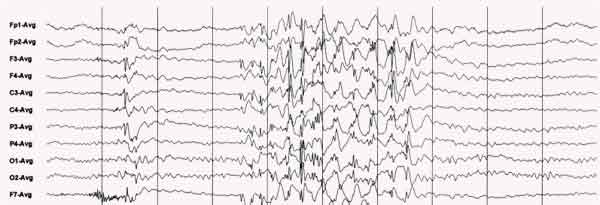
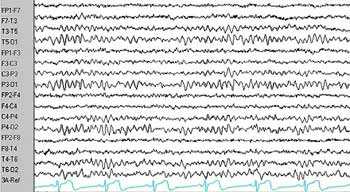
EEG recorded during a generalized epileptic seizure
EEGs offer excellent temporal resolution and are relatively inexpensive compared
with fMRI or PET scans, but their spatial resolution is poor. Nevertheless, EEGs
can help in diagnosing epileptic foci, brain tumours, lesions, clots, and so on.
They can also help to locate the sources of migraines, dizziness, sleepiness,
and other conditions.
When EEGs are used to construct brain maps, procedures
known as evoked potentials are often employed. In an evoked potential procedure,
the subject is exposed to a particular stimulus (such as an image, a word, or
a tactile stimulus) and the neuronal response associated with this stimulus in
the brain is recorded on the EEG.
Another method similar to electroencephalography
is magnetoencephalography (MEG). Like EEG, MEG records the oscillations of the
brain’s neurons, but it does so by means of the weak magnetic fields, rather
than the weak electrical fields, that this activity generates.
| Return to list of imaging methods |
Functional Magnetic Resonance Imaging (fMRI)
Unlike ordinary MRI, which is used to visualize the brain’s structures, functional magnetic resonance imaging (fMRI) is used to visualize the activity in its various regions. The scanning equipment used and the basic principle applied in fMRI are essentially the same as in MRI, but the computers that analyze the signals are different.
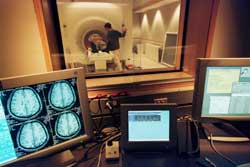
Photo by: Jeff Miller
Source: The Science of Emotions:
Research at the University of Wisconsin-Madison
The physiological
phenomenon on which fMRI (as well as positron
emission tomography) is based was discovered in the late 19th century,
when neurosurgeons found that the brain’s cognitive functions cause local
changes in its blood flow. When a group of neurons in the brain becomes more active,
the capillaries around them dilate automatically to bring more blood and hence
more oxygen to them. Within the red blood cells, the oxygen is carried by a protein
molecule called hemoglobin, which contains an iron atom. Once a hemoglobin molecule
releases its oxygen, it is called deoxyhemoglobin and has a property called paramagnetism,
which means that it causes a slight disturbance in the magnetic field of its surroundings.
This disturbance is used in fMRI to detect the concentration of deoxyhemoglobin
in the blood.
For reasons that will be omitted here, the increase in
blood flow to a more active area of the brain always exceeds this area’s
increased oxygen demand, so the deoxyhemoglobin present becomes diluted in a larger
volume of blood—in other words, its concentration declines. It is this decline
in the concentration of deoxyhemoglobin that fMRI interprets as increased activity
in this area of the brain.
If one fMRI image is recorded of the brain
before the subject performs a task, and another is recorded while the subject
performs the task, and the intensities of the same areas in the two different
images are subtracted from each other, the areas with the largest differences
will appear “lit up”. These areas represent the parts of the brain
that are the most heavily infused with blood, and hence the areas with the greatest
neuronal activity.
Functional MRI of a 24-year-old woman during a word-generation
task
(Source : Dept. of Neurology and Radiology, Münster)
The fMRI method was developed in the early 1990s, when increasingly powerful
computers were coupled with MRI scanners. The recording time for fMRI images can
be as short as 40 milliseconds, and the resolution—on the order of 1 millimetre—is
the best among all the functional imaging technologies. The latest fMRI scanners
can produce 4 photographs of the brain per second, so that researchers can watch
areas of neuronal activity move around the brain while subjects perform complex
tasks.
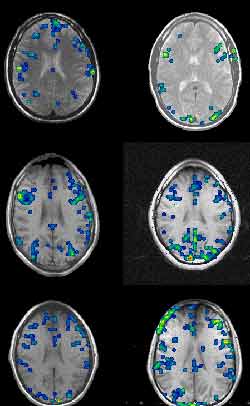
Functional MRIs taken while six different subjects performed
the Stroop text. Note the large variations from one person to another. (Source
: Dr. David C. Osmon)
![]()
The
fMRI method can be used without having to inject any dyes into the subject’s
body, so it is greatly valued in fundamental research. One of its other major
advantages is that the same scanner can provide both structural images and functional
images of a person’s brain, thus making it easier to relate anatomy to function.
Many people regard fMRI as the imaging technique that yields the most impressive
results. But the high costs of purchasing and maintaining fMRI scanners are also
impressive, so their use must often be shared, and there are often long waiting
lists.
| Return to list of imaging methods |
Positron Emission Tomography (PET)
Positron emission tomography (PET), or “PET scanning”, was the first functional brain imaging technology to become available. It was developed in the mid-1970s.
The
physiological phenomenon on which both PET and fMRI
are based was discovered in the late 19th century, when neurosurgeons found that
the brain’s cognitive functions cause local changes in its blood flow. When
a group of neurons in the brain becomes more active, the capillaries around them
dilate automatically to bring more blood and hence more oxygen to this more active
part of the brain.
A person who is going to receive a PET scan must be
injected with a solution containing a radioactive substance. This substance may
be the water itself, or it may be radioactive glucose or some other substance
dissolved in the water. Because the dilation of the capillaries will bring more
of this solution to the more active areas of the brain, these areas will give
off more radioactivity during the PET scan.
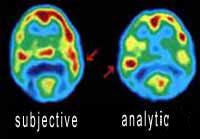
When the same person listens to the same piece of music
first subjectively and then analytically, the right hemisphere is more activated
in one case, and the left in the other.
A positron is
an elementary particle that has the same mass as an electron but the opposite
charge. The positrons emitted in a PET scan come from the decay of the radioactive
nuclei in the solution injected into the person’s bloodstream. As soon as
these positrons are emitted, they annihilate the electrons in the surrounding
atoms, thereby releasing energy in the form of two gamma rays that move in diametrically
opposite directions.
A set of detectors placed around the person’s
head measures the pairs of gamma rays emitted. The computer then uses the resulting
data to calculate the position in the brain from which these rays came. Through
massive calculations, the computer can thus reconstitute a complete image of the
brain and its most active areas.
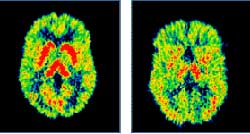
PET scan of the brain of an alcoholic 10 days (left) and
30 days (right) after the start of abstinence
Because
the half-life of the radioactive substances used in PET scans must be short (about
two minutes), these substances must be produced on site, which entails fairly
high costs and thus limits the accessibility of PET scans.
In addition
to showing the functional activation of the brain and detecting tumours and blood
clots, PET scans can be used to determine how particular substances are used metabolically
in the brain. For this purpose, the substances of interest are included in the
radioisotope that is injected. This technique has contributed greatly to the study
of neurotransmitters and enabled researchers to define the distributions of a
number of them.
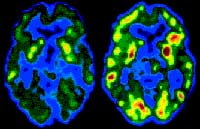
Left: PET scan of the brain of a healthy person. Right:
PET scan revealing lower levels of serotonin (a neurotransmitter) in a person
with severe depression
The images produced by PET scans
cannot compete with those produced by fMRI scans in terms of resolution, but often
provide spectacular colour contrasts (the warmer colours represent the more active
areas of the brain).
With PET scans, the time available for the person
to perform each test task is relatively short (less than a minute), because the
radiation source decays so rapidly. After each task, the person must wait several
minutes for the level of radioactivity emitted to become negligible before another
dose can be administered for the next task.
The radiation doses that
a person receives during a PET session are not very high, but each subject is
nevertheless limited to only one session per year.
| Return to list of imaging methods |
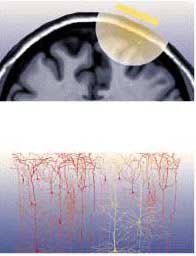
Transcranial Magnetic Stimulation (TMS)
As far back as the early 1960s, researchers
knew how to stimulate nerves with magnetic fields. But it was not until the early
1980s that transcranial magnetic stimulation (TMS) was developed. Its original
use was for studying the motor pathways that descend from the motor cortex down
into the spinal cord and on to the muscles.
TMS lets researchers apply
an electrical stimulus directly to the brain without having to open the skull
surgically and install electrodes. Instead, the stimulus is applied by a magnetic
field that passes through the skull directly and painlessly. This field is generated
by an electrical current running through a coil of copper wire insulated in a
plastic sheath. This coil, which looks like a big spoon, is positioned just over
the skull, above the part of the brain that is to be stimulated.
The
magnetic field generated by the coil current passes through the skull easily and
in turn produces a local electrical current in the person’s brain. However,
the stimulus can be applied no deeper than about 2 centimetres below the skull’s
surface, because the magnetic field attenuates rapidly with distance.
It is very important to position the TMS coil precisely above the brain region to be imaged. In order to do so, a magnetic resonance image of the person’s brain is often taken first, so that the coil can be adjusted for its particular pattern of folds. Stereotaxic devices are then used together with reference points (such as the bridge of the nose) that are visible both on the person’s body and on the MRI to position the TMS coil at exactly the right spot.
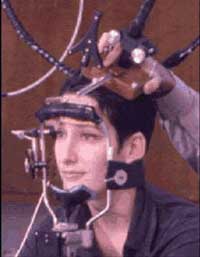
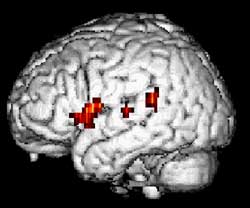
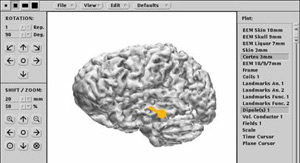
TMS coil mounted on a stereotaxic system used to position
the coil above the area of interest (here, the subject’s left superior frontal
cortex). The same system can be installed on the subject’s head in a PET
scanner.
Source: International Consortium for
Brain Mapping and Dr. Roger Woods, UCLA.
TMS is
often used together with other brain imaging methods in functional brain mapping
studies. For example, TMS is sometimes used to produce an unequivocal physiological
response, such as a muscle contraction. It can also be used to create a temporary
“virtual lesion”: while the subject performs an assigned task, TMS
is applied to cause interference with the part of the brain that is known to be
active during this task.
In a more recently developed variant of TMS,
known as repetitive TMS, the magnetic field is applied repeatedly at relatively
high frequencies. It is believed that repetitive TMS might have some antidepressant
effects if applied to specific parts of the brain for several minutes per day
over several weeks using appropriate stimulation parameters.
| Return to list of imaging methods |
Magnetoencephalography, or MEG, is a relatively non-invasive functional imaging technology that lets scientists and clinicians view the brain in action, by measuring the very weak magnetic fields generated by its electrical activity. MEG was first developed in the 1970s, but did not really come into its own until later on, when more powerful computers and more sophisticated computation algorithms became available.
One of the universal laws of physics is that any electrical current generates a magnetic field around it. Hence, the flows of ions by which the brain's neurons carry out their electrochemical activities generate magnetic fields. These fields are extremely weak, however, and a magnetoencephalograph (also called an MEG) can detect only the sum of the magnetic fields produced by tens of thousands of neurons. This sum is on the order of 50 to 1000 femtoteslas (fT), which is still extremely weak -- about one-billionth the strength of the Earth's magnetic field.
So just how does an MEG detect these very weak magnetic fields and distinguish them not only from the many natural sources of magnetic interference in the environment (such as the Earth's magnetic field), but also from the fields generated electrical appliances, vehicles, and other metal objects in motion?
First of all, MEG systems are always installed in rooms that are heavily shielded against outside magnetic fields. Second, these systems exploit the reversibility of the phenomenon by which the brain produces magnetic fields, using these fields to induce weak electrical currents in electrical coils. These coils are bathed in liquid helium, whose very low temperature (-269°C) causes them to act as superconductors, providing virtually no electrical resistance to the induced currents. These currents can therefore propagate and be measured by superconducting quantum interference devices, or SQUIDs, extremely sensitive instruments that can detect such weak currents.
MEGs can include up to 300 measuring points surrounding the cerebral cortex, which are used to record its activity in real time. Electroencephalographs, or EEGs, also allow the cortex's electrical activity to be viewed in real time, by means of electrodes glued to the scalp. But in this case the electrical signals are distorted by their passage through the various tissues between the brain and the scalp, such as the meninges and the bones of the skull. In contrast, the magnetic fields that the MEG measures pass through these tissues undistorted, so that the sources of these fields can be pinpointed more accurately.
How accurately? MEG provides spatial discrimination on the order of 2 millimetres and temporal resolution on the order of 1 millisecond. In contrast, the temporal resolution provided by positron emission tomography (PET) is measured in tens of seconds. And though functional magnetic resonance imaging (fMRI) devices can gather data at intervals of 50 to 100 milliseconds, the intrinsic inertia in the changing rate of blood flow within the brain limits their temporal resolution to a few seconds.
As with PET and fMRI, the data gathered using MEG experimental protocols can be superimposed on magnetic resonance images to precisely locate the areas of the cortex whose activity changes when the person is performing a particular task. This combined imaging technology is called magnetic source imaging, or MSI.
In clinical settings, MEG is used mainly to detect the foci of epileptic seizures, as well as to identify, prior to brain surgery, areas of the cortex that must be left intact because they perform essential functions.